Teaching and Supervision
Thesis Topics
Here we present a curated list of potential thesis topics for both Bachelor's and Master's programs. These topics have been defined to reflect current trends and demands in geomatics, specifically remote sensing science. Additionaly, students are encouraged to propose a thesis topic of their own interest. For more information please send an email to rsrgedu@uni-bonn.de
Summer Semester 2026

Biospheric Impacts of Global Change Assessed by Optical Remote Sensing
Course content and structure:
Participants will form small research teams (groups of approx. 3-4 students) and work together on one of the global climate change-related topics of their own choosing or provided by the lecturer. Examples of project topics are (not exclusively):
- Impact of sea-level rise and coastal erosion (Europe, Asia, Australia, Pacific).
- Large-scale river floods and their destructive impacts (Europe, Asia, Australia)
- Impact of severe drought (flash-droughts) on forest diebacks (Europe & Australia),
- Thawing Arctic permafrost and its impacts on land cover changes (N. America & Asia),
- Assessing natural and/or societal impacts of large wildfires (N. America, Asia, Australia),
- Melting and retreating of large continental glaciers (Alaska & Greenland).
The course session will include:
- 30-45-minute theoretical lecture introducing the state-of-the-art remote sensing techniques relevant to your projects,
- short presentation by research teams outlining the status and progress of the project work, and
- actual teamwork with hands-on data processing supported by the lecturer.
The remote sensing image analyses and interpretations will be done in professional remote sensing software ENVI, QGIS, SNAP, and/or Google Earth Engine. The required software will be installed and accessible throughout the whole course in the C-Pool at GIUB.
IMPORTANT: Prerequisite for participating in this course is previous successful completion of the B07 module “Introduction to Geomatics”. Successful completion of the course without the basic knowledge of airborne and satellite remote sensing is hardly possible.
The communication language of this course is English (including the final written reports). Although English grammar and style are not part of the report assessment, it must be written in full and understandable sentences using correct English (British or American) spelling and grammar.
Course motivation:
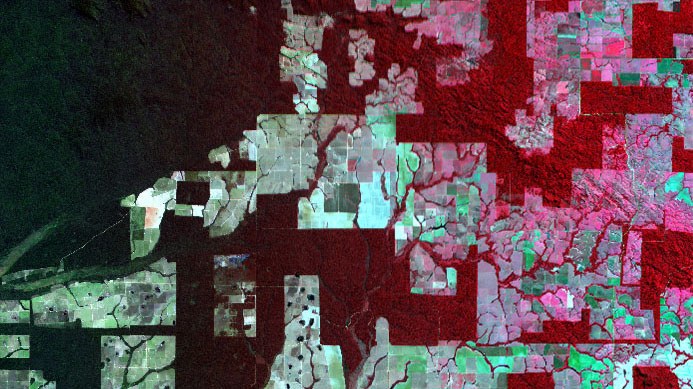
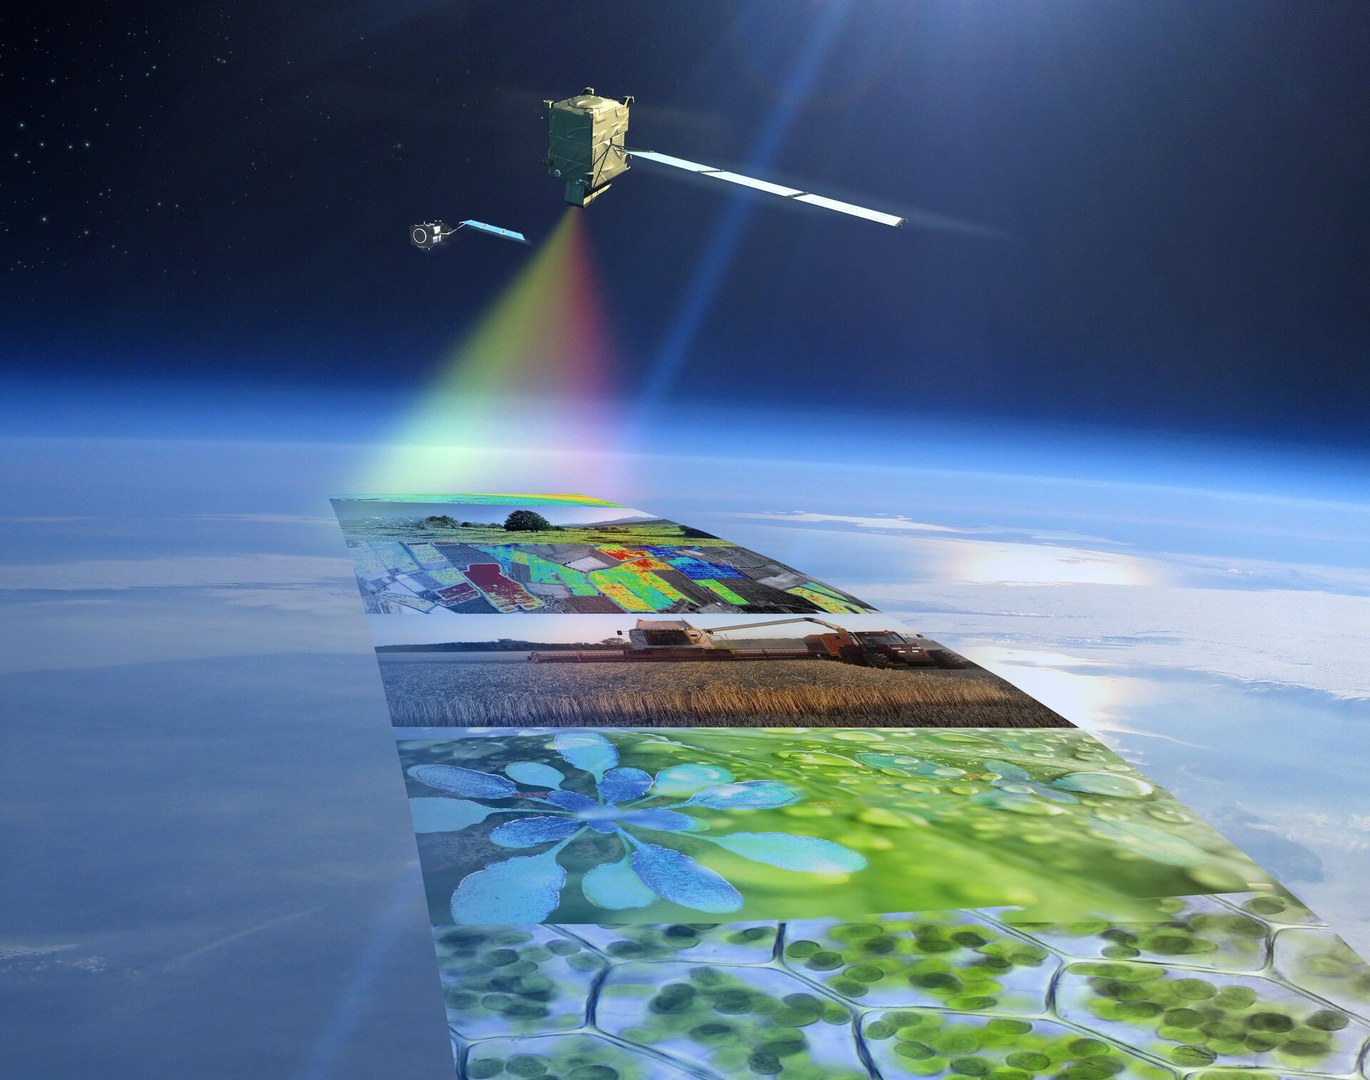
The ongoing climate change (specifically the increase in air temperature caused by human activities) is impacting not only natural processes and biogeochemical cycles but also human societies and their economic activities on a global scale. Recent space-borne constellations of Earth-observing satellites together with advanced remote sensing methodologies are producing a high number of global measurements mapping the Earth's surface changes and biospheric processes. They are providing us with data on, for instance, unprecedentedly severe forest fires, extensive thawing of permafrost, frequent river floods, rapid melting of glaciers, and more. In this project seminar module, we will use global remote sensing optical image acquisitions (e.g., Copernicus/ESA’s Sentinel-2 and NASA’s Landsat-8) and/or thematic products (e.g., NASA’s MODIS FPAR/LAI product) to detect and map the actual impacts of some of the climate change events in space and time. This course is designed for MSc. students interested in carrying out their master's thesis using global remote sensing datasets. Participants will learn how to search, select, and process global satellite datasets stored in open-access “cloud” storages, and how to interpret the content of this data to address recent global climatic societal challenges.
Evaluation of the outcomes:
The last seminar session will be devoted to final presentations of teamwork achievements, followed by scientific discussions, and will offer a possibility to provide feedback regarding the course structure and content. Each team is expected to produce a final report, written according to scientific communication standards. The final grade of each student will reflect the progress and final project presentations, as well as the quality of the final report.
Course expected outcomes:
Upon successful completion of this module, you will know how to:
- find online available optical remote sensing satellite data and process it in the state-of-the-art remote sensing software,
- design and execute a research project, including a proper definition of scientific hypothesis/questions, selection of appropriate optical remote sensing input data and methods, and make synthesis of analytical results answering the research questions,
- write a report in accordance with the scientific standards, including proper presentation of graphical outputs (e.g., maps) and correct referencing of the relevant scientific literature (research papers, books, and conference proceedings), and
- work in a team, present your intentions and results in a concise and understandable manner, receive feedback from your peers and disseminate it to improve your work and conduct an evidence-based scientific discussion.

Remote sensing Methods for detection and monitoring of forest bark beetle outbreaks
Course motivation:
Forests play a crucial role in preserving our planet, as they serve as carbon sinks, absorbing CO2 and regulating the climate. Due to climate change that has largely impacted the natural ecosystems on Earth, forests are more and more threatened, not only by frequent and severe wildfires and droughts, but also by the outbreaks of insect pests such as bark beetle. In past two decades, the European forests were subjected to some of the most widespread outbreaks of Norway Spruce bark beetles, causing substantial damage. Some of the affected areas are remote and hardly accessible, making a ground assessment of the outbreak impacts difficult. In this Geomatic Method seminar, you will use multispectral remote sensing images of Sentinel-2 and Landsat satellite missions to detect the occurrence and to assess the extent of the of the bark beetle infestations in the Bavarian Forest (Germany) during the last decade.
Course expected outcomes:
Upon successful completion of this course, you will know how to:
- search for publicly available satellite imagery in online repositories,
- use scientific literature to search for and process relevant published information,
- apply satellite image processing techniques in the context of forest bark beetle outbreak detection and infested area assessment, and
extract quantitative and thematic information from satellite multispectral imagery by means of image processing techniques.
Course content and structure:
Participants will individually execute several assignment tasks. The tasks will be split into two parts:
- literature work, resulting in an oral presentation describing theoretical bases of forest bark beetle outbreaks mapping from multispectral space-borne image data, and
- computer exercises, comprised of several practical tasks and relevant questions about satellite image processing methods. Python programming language will be used to process the satellite data and apply the suitable image processing methods in order to conduct these tasks. The results will be submitted to the lecturer as a report (in the format of a Jupyter notebook).
Each 2 x 45 min seminar will consist of: - 15–20-minute theoretical introduction related to the assigned task and presented by the lecturer,
- 5-10-minute discussion about general issues and problems related to individual tasks, and
- about 65 min of individual hands-on computer work under the supervision of the lecturer.
The final mark will reflect the quality of the literature work delivered in form of an essay (25% of the overall mark) and the correctness of the satellite image analyses’ outputs and answers to questions given in the computer work part (75% of the overall mark).
Notes:
IMPORTANT: Prerequisite for participating in this course is previous successful completion of the B07 module “Introduction to Geomatic”.
No prior Python programming knowledge or experience is required, however, basic knowledge of satellite remote sensing is strongly recommended.
Successful completion of this module without the basic knowledge of satellite remote sensing is possible but will require extra workload above original expectations.
The communication language of this course is English (including the final written reports). Although English grammar and style are not part of the report evaluation, it must be written in full and understandable sentences using proper English (British or American) formulations.

Application of machine-learning methods and AI tools in physical geography
Course Motivation
Machine learning and artificial intelligence are increasingly shaping how environmental data is analyzed, interpreted, and used in decision-making. In physical geography, these methods are now widely applied to topics such as land cover mapping, climate analysis, hazard assessment, and ecosystem monitoring. This seminar introduces students to modern ML and AI approaches as practical tools for geographic research, while also fostering a critical understanding of their possibilities, limitations, and responsible use.
Course Content
The seminar introduces machine-learning methods and AI tools for applications in physical geography. Students gain an overview of supervised and unsupervised learning approaches and commonly used methods such as Random Forests, clustering techniques, and neural networks. The course combines conceptual input with hands-on exercises using GIS software (QGIS, ENVI) and guided Python workflows. No prior programming experience is required; all Python exercises are fully guided and supported by AI tools to assist with coding and data exploration. In addition, students learn to identify suitable ML applications, design simple project concepts, interpret results in a geographic context, and critically reflect on limitations, uncertainty, and scientific validity of ML-based approaches.
Course Structure
The course is held weekly as a two-hour seminar. Each session typically begins with a short lecture (approximately 30–45 minutes) introducing theoretical concepts, methods, or case studies. This is followed by hands-on computer-based exercises in which students apply the discussed methods using GIS software and Python. Throughout the semester, students also engage in small group work and short presentations, particularly when developing and presenting their own project concepts.
Expected examination perfomance
The final grade is based on the assessment of the exercise submissions during the semester, as well as a small project and its presentations.
Course Outcomes
After successfully completing the seminar, students will be able to:
- Explain basic machine-learning methods commonly used in physical geography
- Identify suitable applications of ML for geographic research questions and design simple project concepts
- Apply basic ML workflows using GIS tools and Python libraries
- Interpret and critically assess ML results in relation to physical processes and spatial patterns
- Understand key limitations of ML approaches, including uncertainty, bias, and generalization issues
- Critically evaluate scientific literature that applies ML methods in physical geography
- Use AI-based tools responsibly and reflectively in an academic context
These seminars are part of the “International Classroom” program. International students who would like to participate should contact: erasmus-giub@uni-bonn.de

Remote Sensing Mapping for Environmental Monitoring
Mandatory Requirement
Please note that this module has the following prerequisites: The following modules must be successfully passed before registering for the exam: B2, B6, B7
Course motivation
The ongoing global climate change, mainly the increase in air temperature caused by human activities since the industrial revolution, is impacting not only natural processes and cycles but also human societies and their economic activities on a global scale. We are witnessing, for instance, unprecedently severe forest fires in the northern America, la Niña induced floods in eastern Australia, extensive thawing of permafrost in Siberia and Alaska, unexpected drying of large water bodies due to the freshwater shortage, and rapid melting of glaciers in the Arctic regions and high mountains. In this project seminar module, we will use optical remote sensing image data acquired from satellites orbiting the Earth (e.g., Copernicus/ESA’s Sentinel-2 and NASA’s Landsat-8 & 9) or from hyperspectral visible, near-infrared, and thermal images from aircrafts (e.g., airplanes) to detect, map, and potentially monitor in space and time the actual impacts of climate change specific, but not exclusive, events on the Earth surface.
Course structure
Participants will form small research teams (groups of approx. 3 students) and work together on one of the climate change-related topics of their own liking or provided by the lecturer.
Expected examination perfomance
The last seminar will be devoted to final presentations of teamwork achievements in form of the scientific poster, followed by scientific discussions. Each team is further expected to produce a short final report (maximum of 20 standard A4 pages without the list of references), written in English according to scientific communication standards. The final mark will reflect the quality of the final poster presentation (40%) and report (40%) but also the performance of individual team members during the course (20%).
Course outcomes
- Upon successful completion of this module, you will know how to:
find online available optical remote sensing satellite data and process it in the state-of-the-art remote sensing software, - design and execute a research project, including a proper definition of scientific hypothesis/questions, selection of appropriate optical remote sensing input data and methods, and make synthesis of analytical results answering the research questions,
- write a report in accordance with the scientific standards, including proper presentation of graphical outputs (e.g., maps) and correct referencing of the relevant scientific literature (research papers, books, and conference proceedings), and
- work in a team, present your intentions and results in a concise and understandable manner, receive feedback from your peers and disseminate it to improve your work and conduct an evidence-based scientific discussion.
If you have questions or need further information please contact rsrgedu@uni-bonn.de.
Introduction to GIS for Disaster Risk and Hazard Mapping
Der Block-Kurs richtet sich an Studierende mit Interesse an Risiko- und Gefahrenkartierung. Es wird ein praxisorientierter Einstieg in GIS und Fernerkundung zur Erstellung von Gefahrenkarten vermittelt. Der Fokus liegt dabei auf Naturgefahren wie Überschwemmungen, Stürme oder Waldbrände. Zentrales Werkzeug im Kurs ist QGIS. Mit dem QGIS Model Builder werden automatisierte, modellbasierte Analyse-Workflows zur Gefahrenkartierung entwickelt. Als Datengrundlage werden digitale Geländemodelle, Satellitendaten und weitere frei verfügbare Datensätze, wie Open Spatial Demographic Data verwendet.
Die Teilnehmenden erlernen die Erstellung (einfacher) eigener Modelle und binden diese in QGIS ein. Die Teilnehmenden erhalten eine Einführung in die Anwendung (einfacher) Python-Ausdrücke innerhalb des Model Builders, wie auch eine Einführung in weiterführende Anwendungen zur Datenverarbeitung mit Python über Programm Skripte in QGIS und/oder Jupyter Notebooks.
Der Kurs stellt eine methodische Vertiefung der in den GIS-Tutorien vermittelten Inhalte dar. Grundkenntnisse in QGIS werden vorausgesetzt; der erfolgreiche Abschluss der Geomatik Vorlesung mit Tutorien ist ausreichend.
Ergänzend zum technischen Arbeiten werden Einsatzmöglichkeiten der erzeugten Gefahrenmasken in der Risikokommunikation vorgestellt. Der Kurs kann auf Deutsch oder Englisch durchgeführt werden.
Prüfungsleistung: Eigenes Projekt, in dem die entwickelten Workflows zur Analyse einer Gefahr vorgestellt und die Ergebnisse präsentiert werden. Die Prüfungsleistung kann entweder in Form eines Berichts oder als ausführliche Anleitung des erstellten Produkts eingereicht werden.
Der Kurs soll in der ersten Septemberwoche stattfinden.

Introduction to Remote Sensing and Spatial Analysis in ArcGIS: Cologne as Urban Heat Island
Description and Contents
Course motivation and expected outcomes:
In this seminar, you will learn how to use optical remote sensing (RS) for spatial analyses in geographic information systems (GIS) to tackle today’s societal challenges. By applying practical demonstrations, we will explore how raster data from space-borne observations, combined with GIS vector layers, can provide unique insights into various environmental protection, human health, food production, and urban planning problems. The practical case study will focus on the urban heat island (UHI) effect, using the city of Cologne as an example. In the final part of the course, we will also discuss the design of proper maps and various graphical presentations of results obtained from geospatial data analyses.
Course content and organisation:
The 2-hour sessions will consist of a theoretical part, in which the basics and theoretical backgrounds will be introduced, and a ‘hands-on’ computer exercise where you will practice the newly-gained theoretical knowledge. Throughout the course, you will gain skills in operating ArcGIS software for geospatial analysis. The required software will be installed and accessible throughout the whole course in the Ü9 room at GeoZentrum. The course will be concluded by a computer-based examination test (multiple-choice). The final grade will be deduced from your test results and the results you generate during the practical computer exercise.
Comments:
- This course will be entirely conducted in the English language.
- Previous knowledge of basic quantitative statistics methods and satellite or airborne remote sensing data is desirable.
Specific study literature will be recommended by the lecturer during the seminar lectures.
Winter Semester 2025/2026
Optical Remote Sensing for Land Surface Mapping and Environmental Monitoring
Remote Sensing Methods for Wildfire Landcover Change Detection
Forests play a crucial role in preserving our planet, serving as carbon sinks that absorb CO2 and regulating the climate. Due to climate change, natural ecosystems on Earth were heavily impacted and forests are more and more threatened by severe wildfires. In 2016 and 2019, Australia, especially the Tasmanian island, was subjected to some of the most widespread and devastating wildfires in recent history. What made these fires so devastating is the particularly ”dense bush” type of Australian vegetation that they affected. In 2016, large parts of the Tasmania World Heritage Area and the Arthur-Pieman Conservation Area were destroyed. These vegetation communities are unique and take thousands of years to regrow. Many affected areas are remote and largely inaccessible, making a ground assessment of the true scale of the fire devastation difficult, in some locations even impossible. In this Geomatic Method seminar, you will use multispectral remote sensing images of Sentinel-2A and Landsat-8 satellites to identify the extent of the wildfires within the Arthur-Pieman Conservation area and estimate the types and amounts of vegetation that were affected by the 2016 burn.
Participants will individually execute 12 assignment tasks. The tasks will be split into two parts:
literature work (2 tasks), resulting in a short (400 words max.) essay describing theoretical bases of forest fire mapping from multispectral space-borne image data (written in English), and
computer work, consisting in 10 practical tasks and several questions about satellite image pre-processing methods (e.g., spatial and radiometric corrections), spectral analyses (e.g., automatic image classifications), and landcover change detection (e.g., basic statistics). The results will be submitted to the lecturer as a report, i.e., *.PDF or *.DOCX digital document written in English.
Each of the 2 x 45 min seminars will consist of:
15-minute theoretical introduction related to the assigned task and presented by the lecturer,
5-10-minutes of discussion about general issues and problems related to individual tasks, and
about 65 minutes of individual hands-on computer work under the supervision of the lecturer.
The final mark will reflect the quality of the literature work delivered in form of an essay (30% of the overall mark) and the correctness of the satellite image analyses’ outputs and answers to questions given in the computer work part (70% of the overall mark).
Upon successful completion of this module, you will know how to:
use scientific literature to search for and process relevant published information,
apply satellite image processing techniques in the context of forest fire detection and bunt area assessment, and
extract quantitative and thematic information from satellite multispectral imagery by means of image pre-processing, classification, and change detection techniques.
The professional remote sensing software ENVI will be used in this module for computer-based work. The basic functionality of this software, i.e., loading and displaying an image with different spectral band combinations, image composition contrast enhancement, plotting of spectral signatures, working with regions of interest (ROIs), application of required image analyses, and export of images and plots suitable for inclusion in your assignment report, will be explained during first seminar sessions. Previous knowledge about remote sensing image processing will be to your advantage.
If you have questions or need further information please contact rsrgedu@uni-bonn.de.
Introduction to Geomatics
This module introduces geomatics, including the theory and application of geo(informatic) methods. It combines the complementary and methodologically fundamental components that are central to geography education: working with Geographic Information Systems (GIS), Cartography (KART), and Remote Sensing (RS). The focus is on the acquisition, analysis, modeling, and visualization of spatial information. Remote Sensing deals with the collection and evaluation of information about spatiotemporal processes and structures using aircraft- and satellite-based sensor systems. GIS is used for the analysis and modeling of spatial structures, patterns, and processes.
Cartography is addressed in the lecture from two perspectives: first, as a spatial reference system for geodata, and second, as a methodological toolkit for the visualization of spatially referenced data. In this module, you will acquire the necessary theoretical, methodological, and practical foundations to work with geodata, interpret and analyze it professionally, and apply your knowledge practically using various software packages.
The lecture consists of two parallel parts with joint exercises. In the first part, knowledge of GIS and Cartography is taught; in the second, that of Remote Sensing. Participants form working groups that alternately complete exercises from the GIS/Cartography and Remote Sensing areas. They are supported by the tutors of the Geomatics Student Workshop.
The exams will most likely take place during the following periods:
1st date: 23–27 February 2026
2nd date: 23–27 March 2026
Please note that the exact dates will be announced during the lecture and will then be binding.
Geomatics-Coordination Study Workshop
The tutors support you in solving the exercise assignments. They also receive the solutions to the exercises and record your completion. Submitting the exercise assignments is a prerequisite for being admitted to the exam.
Within the tutorial sessions, please form fixed exercise groups of 2–3 people (only with participants from your own tutorial group). Through the email function of eCampus, you can contact all participants of your tutorial individually or together. You simplify communication by adding your name to your eCampus profile in addition to your university ID. You can access your eCampus profile by clicking the small arrow at the very top right.
You can reach the tutors by email. You can then arrange a Zoom meeting with your tutor or receive the answer by email. Or you can come to the times reserved for exercise groups on Monday (16:15–17:45), Tuesday (16:15–17:45), Thursday (10:15–11:45 or 16:15–17:45), in room Ü9 at Meckenheimer Allee 176. There you can use the computers. Two tutors are always present and available during these times.
The exercise assignments
A total of 11 exercise assignments will be given. You must submit the results of all 11 exercise assignments. The working periods for the exercises partially overlap because the assignments are often released on a weekly basis.
Introduction to Remote Sensing Time Series Analysis
This course introduces time series analysis for remote sensing with an emphasis on practical demonstrations and applications using Google Earth Engine (GEE). In the first section of the course, students familiarize themselves with GEE through its Code Editor, starting with core concepts such as data types, geometries, feature collections, image collections, filters, indices, and statistical reducers, paired with practical hands-on demonstrations sections using programming scripts. In the second section, the theoretical and practical scope of the course expands through the use of the Earth Engine's Python API, and use deploy this in Jupyter Notebooks to reproduce analyses and handle complex tasks while integrating Python packages into the different analysis pipelines. Topics include basics of remote sensing, time series concepts and analysis, using bitemporal change detection, Change Vector Analysis (CVA), Index-based time series, machine learning classification, Post-Classification Comparison (PCC), and dense time-series analysis using BFAST to detect seasonal trends and breakpoints and explore methods for smoothing and gap filling. Throughout the course, students visualise and quantify changes in satellite imagery, and finish by developing and delivering a final project based on Earth Observation analysis, applying the learned concepts and tools.Aufklapp-Text
Physische Geographie
Writing BSc./ MSc. Thesis at RSRG
If you are interested in writing a bachelor or master thesis in the field of remote sensing, please contact Vanessa Spitzer to arrange an appointment with Prof. Z. Malenovský.
Feel free to bring your own topic suggestions or find a suitable topic by talking to Prof. Malenovský.
Contact
For enquiries regarding courses, thesis or other educational matters, please contact:
For enquiries regarding research or projects, please contact:
Opening Hours Secretary
- Monday - Wednesday, Friday: Department of Geography
09:00 am - 03:00 pm - Thursday: ZFL
09:00 am - 03:00 pm